You don’t have to go very far back in time to revisit what the end of a bull market in gold looks like.
The last big gold bull ended in 2012.
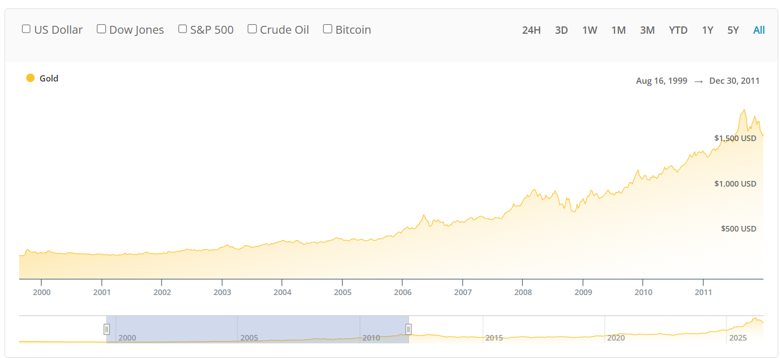
It began in the late 1990s, taking gold from a 20 year low near $250/oz to over $1,800/oz in August 2011, and declining from $1,700 in October 2012 down to just over $1,000 in 2015.
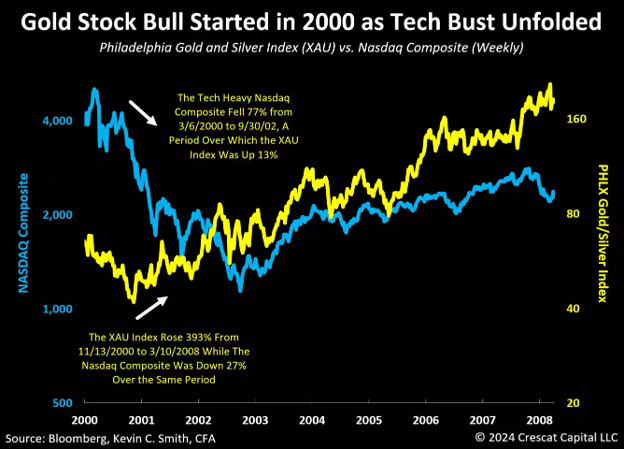
Gold stocks (our primary area of interest) lagged gold by a year or so, but eventually started to soar, just as tech stocks took a digger starting in 2000:
If you’re trying to avoid buying into the tail end of a bull market in gold stocks, you need to know what one looks like.
In 2009, gold punched through $1,000 for the first time ever. Gold stocks had already moved higher for the previous nine years, and there was a lot of capital flowing into new deals.
Gold major Barrick famously took a $4 billion writedown in 2012, which ballooned to over $5 billion thanks to its Pascua Lama project a year later, eventually peaking at over $8 billion in total losses. The pain didn’t stop until 2025, when after years of legal battles and ongoing writedowns, Barrick spent a final $136 million closing out the project.

To contextualize how bad this deal hurt Barrick, consider that despite average gold production costs under $700/oz and gold prices over $1,700 in 2012, the company managed to lose money.
Barrick’s stock price dropped from $55/share in 2011 to $5 in 2015. The stock has still not recovered back to its 2011 highs…
Of course, Barrick wasn’t alone, and it wasn’t just gold stocks that went out of their way to find bad deals.
On the same day that Barrick posted these horrendous 2012 earnings, Rio Tinto PLC (NYSE: RIO) took a $14 billion writedown on its aluminum business.
The entire gold stock sector dropped 75% peak to trough, while gold itself only fell ~40%.
Once you understand how badly it went for a gold major like Barrick – which still hasn’t fully recovered from deals it made in the 2000s and was STILL paying the price as recently as last year, then you can start to understand where we are in the current cycle.
In short, most of the operators in this business are just getting over the wounds they incurred in 2012. They remember touching the hot stove and have no interest in burning their hands again.
The deals we’re seeing so far are conservative for the most part. Companies are building out their models based on $3,000 gold, or lower. We’re not seeing the big, leveraged bets on long shot, low mineralization properties.
The takeovers and mergers we’re seeing also haven’t been for gigantic multiples either, just yet.
We’re still in the early to middle innings of this bull market.
Invest accordingly.
Best,
Garrett Goggin, CFA, CMT
Lead Analyst and Founder, Golden Portfolio