It’s the most common question I get outside of “which gold stocks should I own?”
People want to know, “how much higher can gold go?”
When you see gold screaming towards all time highs, it’s a very reasonable question to consider… After all, if the price is due to fall or we’re near some kind of price ceiling, there's no sense in buying more gold now.
The problem is merely looking at the price of gold in dollars gives you very little context for where gold sits in its price trajectory. The dollar is being aggressively undermined from every angle. US debts are the largest in human history and slated to grow.
So, by only looking at a long term price chart of gold price in dollars, you’re really just holding up a chart that shows dollar devaluation over time. Dollar go down, gold go up. That’s not informative. It doesn’t tell you if gold is expensive or cheap relative to anything except for the dollar!
In order to get a better frame for where gold is, you need to strip out the dollar component, and compare gold to other financial assets – all of which are of course also valued in dollars.
One of the most historically relevant financial assets to compare gold to is the Dow Jones Industrial Average, which simply averages 30 of the most important publicly traded companies in the US. This index is calculated by price-weighting each component.
So if you divide the price of gold into the Dow Jones Industrial Average, you get a number that separates out dollar movements, and it shows you the relative movements between gold and the Dow.
It’s basically telling you how many ounces of gold it takes to buy the Dow.
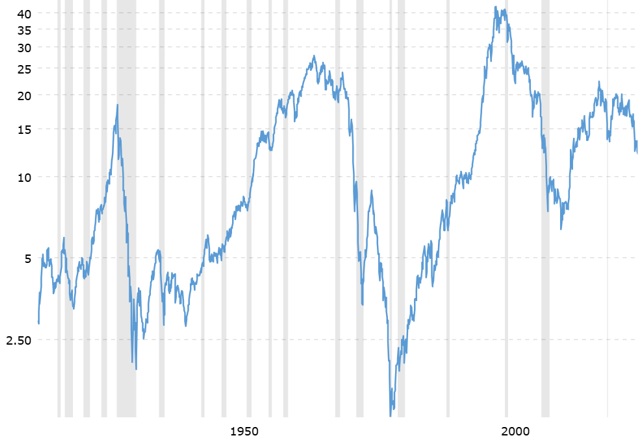
Right now we can see that despite massive gains for the price of gold, it’s still more or less in the middle or long term average when you compare it to stocks. It takes about 12 ounces of gold to buy the Dow.
The low came in the early 1980s when gold and the Dow were both briefly selling for around the same price. If you recall, that’s when stocks were near multi-decade lows, and gold was at all time highs. It got so bad for stocks that Business Week published their now infamous “Death of Equities” headline within 5 months of the beginning of the greatest bull market in stocks ever, which kicked off in early 1980 and lasted until 2000. Pretty good timing.
But right now, this ratio is saying “gold is neither over nor undervalued relative to stocks.”
At the same time, this ratio tells us nothing about the future movement of gold. Both gold and stocks could fall from here, or stocks could soar while gold crashes.
Gold and stocks could also rise in tandem.
This year for instance, we’ve seen multiple new highs for stocks AND gold, sometimes within the same time frame. That’s unusual in history, but totally understandable if you recognize that investors would rather not hold cash, and instead prefer to pile into other assets as best they can.
What we do know from bull markets in gold historically is they tend to last for a while, and they end when gold gets close to par with the Dow. Right now, stocks are still riding the same crest as gold.
You might also recall that the only way people got off the gold bull in the early 1980s was after Paul Volcker pushed rates above 15% for the long end of the yield curve. That kind of bond yield tends to be a pretty compelling reason to dump gold.
But again, we’re nowhere near that time or place in monetary history. The Fed is lowering rates at the same time that both stocks and gold are at all time highs. Cutting rates with assets at record levels is a new move we haven’t seen. It’s Ben Bernanke’s punch bowl, except instead of taking it away, or leaving it out, they’re adding more booze.
It’s almost as if the goal is to destroy the dollar in order to inflate away debts…
In the meantime, gold is about to tiptoe past $4k/ounce – which will probably mean we’ll have some interesting insights from the market when it happens.
Maybe people will wake up to the gold bull that’s been helping push gold stocks higher too?
Best,
Garrett Goggin, CFA, CMT
Chief Analyst & Founder, Golden Portfolio